

Why the S&P 500’s 11% “Average” Return Is Misleading
The S&P 500’s "11% average return" isn’t what it seems. A few big years and dominant stocks skew the numbers, masking the volatility and hidden risks that shape real investor returns. Here’s what you need to know.


When investors hear that the S&P 500 has "averaged 11% annual returns," it often creates the illusion of consistent, predictable growth. In reality, this figure obscures the volatility and irregularity of market performance. The index’s long-term returns are not evenly distributed—rather, they are heavily influenced by a handful of exceptional years and dominant companies that disproportionately drive its Compound Annual Growth Rate (CAGR).
Breaking Down the S&P 500’s Long-Term Performance
A simple average can be deceptive. Consider this example:
- If an investment gains 100% in one year but then declines by 50% the next, the simple average suggests a +25% return per year
- However, in reality, your investment would be back to its original value—meaning the actual CAGR (annualized return) is 0%.
This highlights a crucial point: CAGR smooths out fluctuations, but it does not reflect the volatility of individual years.
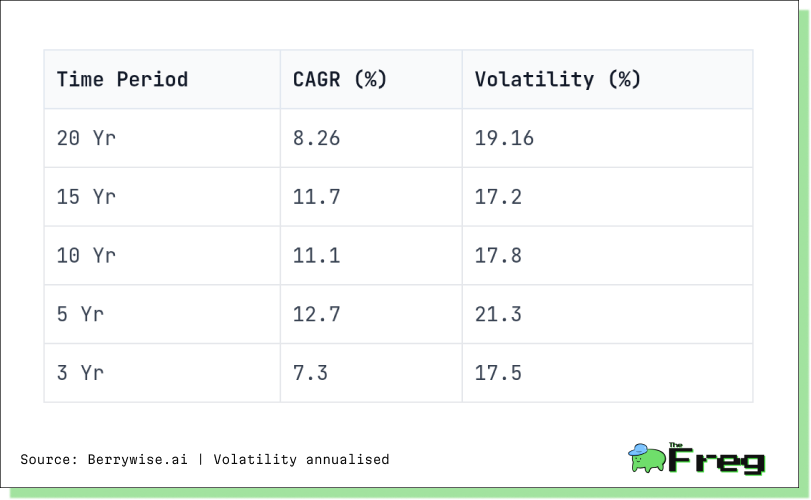
Over the past 10 years, the S&P 500 has had a CAGR of 11.1%, with a standard deviation of 17.8%—indicating substantial variability.
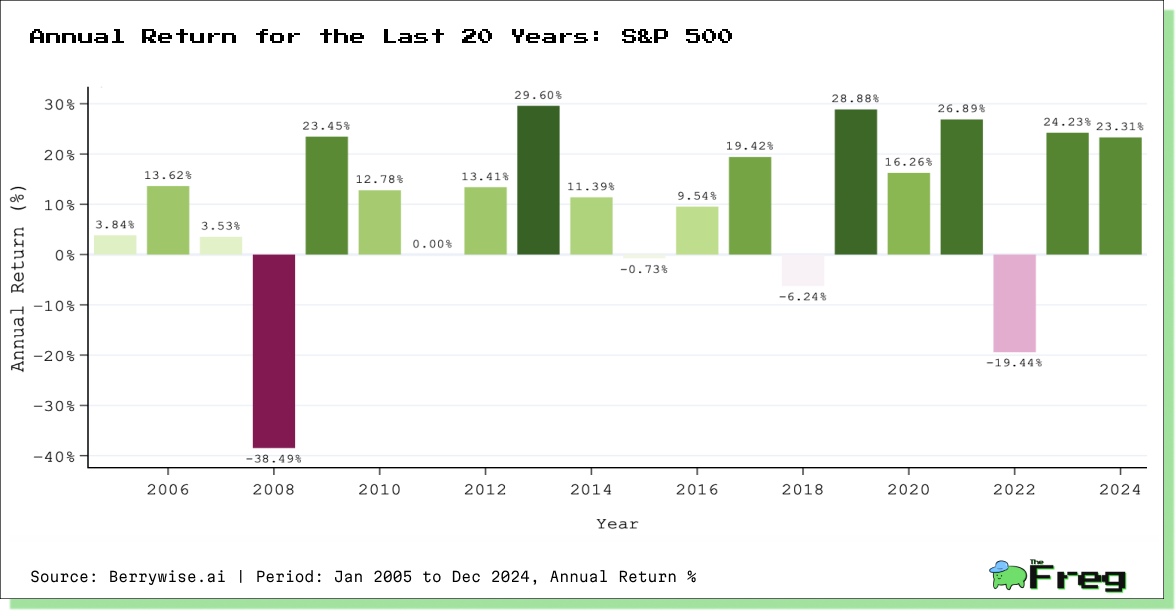
Despite the long-term positive trend, yearly returns have been highly inconsistent:
The Mathematics of Compounding: Why Losses Hurt More Than Gains
CAGR is highly sensitive to extreme values—a few standout years can disproportionately inflate long-term performance.
For example:
- In 2019 and 2021, the S&P 500 returned +28.88% and +26.89%, respectively.
- These two years alone significantly boosted the 10-year CAGR.
- If we exclude those two years, the 10-year CAGR drops from 11.1% to approximately 5.88%.
This demonstrates that a few strong years carry much of the index’s long-term performance, rather than consistent annual growth.
Compounding plays a critical role in wealth accumulation, but it also magnifies the impact of downturns.
For example: A 50% gain followed by a 50% loss does not leave you with a 0% return—instead, it results in a 25% total loss.
This non-linear effect is why investors often underestimate the impact of extreme fluctuations on their portfolio’s long-term growth.
CAGR Decomposition: Understanding Yearly Contributions
A CAGR decomposition chart can visually show how much each year contributes to overall long-term returns. Such a visualization helps investors differentiate between consistent growth and a growth rate skewed by a handful of exceptional years.

The Growing Influence of Market Leaders
In recent years, a small number of companies have come to dominate the S&P 500.
Market Concentration at Historic Levels
- By 2024, the top 10 stocks accounted for 33% of the S&P 500’s total value—higher than the 27% concentration during the 2000 dot-com bubble.
- The "Magnificent Seven" (Apple, Microsoft, Alphabet, Amazon, Meta, NVIDIA, and Tesla) contributed nearly half of the index’s returns while representing just one-third of its market capitalization.
- In 2024 alone, NVIDIA accounted for almost 25% of the S&P 500’s total gains.
This concentration risk means that even if an investor is broadly diversified across the S&P 500, their returns are increasingly dependent on just a few large companies.
The idea that the S&P 500 "averages 11% per year" is an oversimplification that masks significant volatility and concentration risk. A small number of outlier years and dominant stocks drive much of the long-term growth.
By understanding how CAGR is decomposed and how extreme events shape long-term returns, investors can set more realistic expectations and develop a more resilient investment strategy.
Disclaimer: This article is based on data analysis and does not constitute investment advice. Investors should conduct their own research and consult with financial advisors before making investment decisions. Past performance is not indicative of future results.


