

Tesla vs. General Motors: Divergent Roads in the Auto Sector’s Next Decade
Tesla and GM chart distinct paths in the auto sector’s EV race. Tesla leads in innovation and margins but faces growth slowdowns and volatility. GM leverages steady ICE/EV sales, offering income and stability. Investors must weigh growth versus resilience.


Tesla and General Motors (GM) remain two of the most scrutinized automakers globally, each representing a distinct approach to electrification, innovation, and capital allocation. As of mid-2025, Tesla’s delivery growth has moderated, but its focus on technology and energy solutions remains central. GM, meanwhile, is leveraging its scale and legacy brands to accelerate both combustion and electric vehicle (EV) sales, while recalibrating its ambitions in autonomous driving. This analysis contrasts their financials, operational momentum, market positioning, and investment prospects.
Sector & Market Landscape
Automotive sector: Facing cyclical demand, regulatory shifts, and rapid electrification. The automotive industry is undergoing its most significant transformation in a century, shaped by both economic cycles and sweeping regulatory changes. Demand remains cyclical, fluctuating with macroeconomic conditions, while governments worldwide are enacting stricter emissions standards and setting aggressive timelines for phasing out internal combustion engines. The sector’s rapid electrification is fuelled by these policies and by consumer preferences shifting toward cleaner, more technologically advanced vehicles. Automakers are under mounting pressure to innovate, adapt product lines, and invest heavily in electrification to remain competitive and compliant.
EV penetration: Accelerating, but competition is increasing globally. Electric vehicle adoption is surging, with global EV sales expected to reach 10% of all new car sales by 2025 and potentially over 30% of the global fleet by the end of the 2030s. Europe has overtaken China as the largest plug-in EV market, while the US is also seeing double-digit EV market share growth. However, this rapid expansion is attracting new entrants and intensifying competition, particularly from Chinese manufacturers and start-ups. As a result, established automakers face pricing pressures, the need for differentiated technology, and the challenge of scaling production efficiently in a crowded field.
Macro headwinds: Interest rates, consumer sentiment, policy uncertainty, and geopolitical tensions. High interest rates have raised the cost of auto financing, dampening new vehicle demand and prolonging ownership cycles. Inflation and tariffs on vehicles and auto parts are pushing up production costs and consumer prices, leading to strategic shifts in supply chains and manufacturing locations. Policy uncertainty, particularly around emissions standards and trade, adds complexity to planning and investment decisions. Geopolitical tensions—especially between China, the US, and Europe—are influencing global sales strategies, technology partnerships, and the competitive landscape, making 2025 a year of both risk and opportunity for automakers.
Key themes: Supply chain resilience, software integration, energy storage, and autonomous driving. The industry is prioritizing supply chain resilience in response to recent disruptions, with a focus on localization, ethical sourcing, and technological integration such as blockchain and AI to enhance transparency and efficiency. Software is becoming central to vehicle value, driving advances in connectivity, cybersecurity, and user experience—effectively transforming cars into “computers on wheels.” Energy storage innovation, including solid-state batteries and bidirectional charging, is critical for EV adoption and grid integration. Meanwhile, autonomous driving technology is progressing, with Level 2 automation becoming mainstream and further advancements in AI and sensor technology expected to reshape mobility.
Overview- Tesla
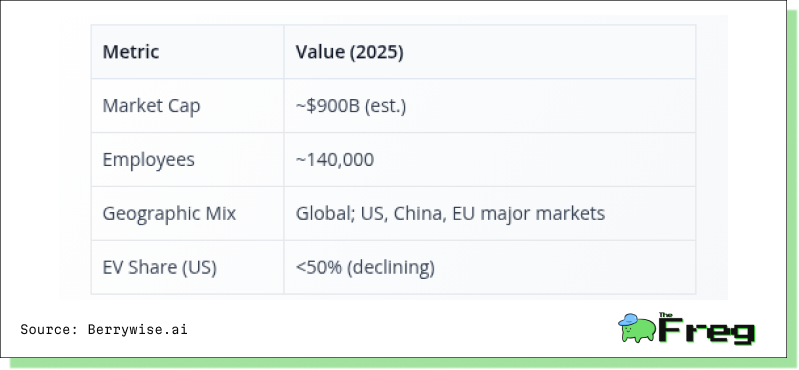
Business & Scale
- Pure-play EV manufacturer with integrated energy storage and software solutions.
- Major models: Model 3, Model Y, Cybertruck, Model S/X.
- Expanding into AI, autonomous driving (FSD), and energy products.
Financial Highlights
- Q2 2025 deliveries: 384,122 vehicles (down slightly YoY), production: 410,244 units.
- Energy storage deployments: 9.6 GWh in Q2 2025 (record high).
- 2025 projected revenue: $112.1 billion; normalized EPS: $1.91..
Key Business Segments and Revenue Mix
- Automotive sales (Model 3/Y dominate volume).
- Energy generation and storage (Megapack, Powerwall).
- Software (FSD, subscription services).
Overview- General Motors
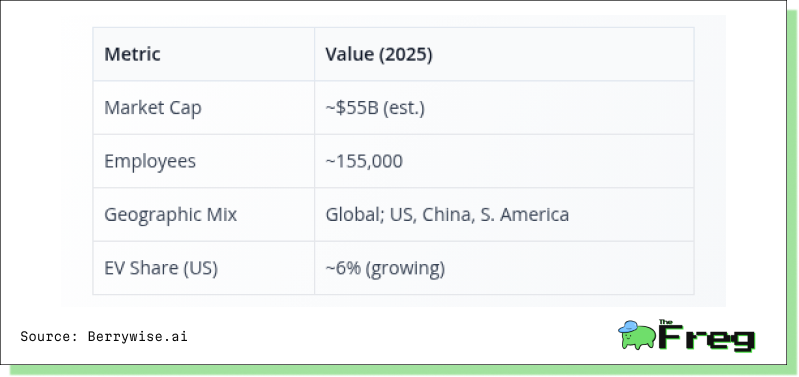
Description & Scale
- Legacy automaker with diversified ICE and EV portfolios.
- Brands: Chevrolet, GMC, Cadillac, Buick.
- Second-largest EV seller in the US after Tesla.
Financial Highlights
- Q1 2025 revenue: $44.0 billion; net income: $2.8 billion.
- Q2 2025 deliveries: up 7% YoY; H1 2025 up 12% YoY.
- Q2 2025 EV deliveries: 46,280 units (+111% YoY), ~6.1% of total.
- 2024 US deliveries: 2,575,283 vehicles.
Key Business Segments and Revenue Mix
- ICE vehicles (trucks, SUVs, crossovers).
- EVs (Chevy Bolt, Cadillac Lyriq, Hummer EV, etc.).
- Financial services.
Recent Stock Performance
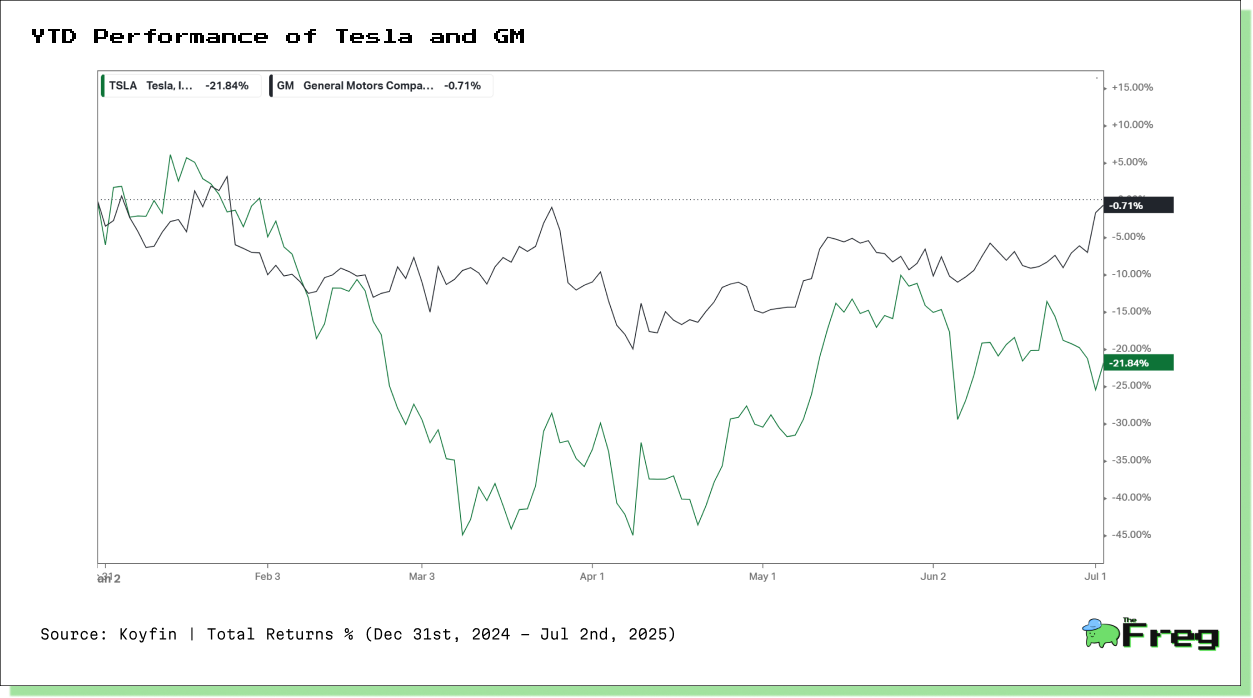
Tesla (TSLA):
Year-to-date return: -21.84%
The stock has experienced significant volatility, with pronounced drawdowns in March and May.
Despite attempts at recovery, TSLA remains deeply negative for the year, reflecting concerns over slowing delivery growth, margin pressure, and shifting market sentiment.
General Motors (GM):
Year-to-date return: -0.71%
GM’s stock has shown relative resilience, with less volatility and a much smaller drawdown.
The stock has largely tracked sideways, outperforming Tesla by a wide margin in 2025, likely due to steady ICE/EV sales and a more attractive valuation.
Tesla’s underperformance highlights the market’s sensitivity to its high valuation, execution risks, and competitive pressures in the EV space. The steep decline suggests that investors are reassessing growth expectations amid a more challenging macro and sector backdrop.
GM’s relative stability reflects its diversified business model, lower valuation, and the market’s preference for defensive, income-generating stocks in a risk-off environment.
So far in 2025, GM has significantly outperformed Tesla in terms of share price stability and total return, underscoring a shift in investor preference toward established automakers with balanced ICE/EV exposure and more predictable earnings. This divergence is a critical factor for investors weighing growth potential against current market sentiment and risk.
Strategic Positioning & Competitive Dynamics
Tesla
- Strategic Focus: Growth via innovation, software, and vertical integration.
- Technology/Innovation: FSD/AI, energy storage, Robotaxi platform (pending), affordable EVs in pipeline.
- Initiatives:
- Expansion of Model Y production in the US, China, Germany.
- Scaling Megapack and Powerwall deployments.
- Aggressive R&D in AI and autonomous driving.
General Motors
- Strategic Focus: Turnaround and market share gains in EVs, while leveraging ICE leadership.
- Technology/Innovation: Battery R&D, Ultium platform, Cruise (robotaxi) scaled back for capital discipline.
- Initiatives:
- $4B investment in US manufacturing for next-gen ICE and EVs.
- 30 new EV models globally by 2025.
- Strategic partnerships (Uber for Cruise, battery suppliers).
Financial Scorecard
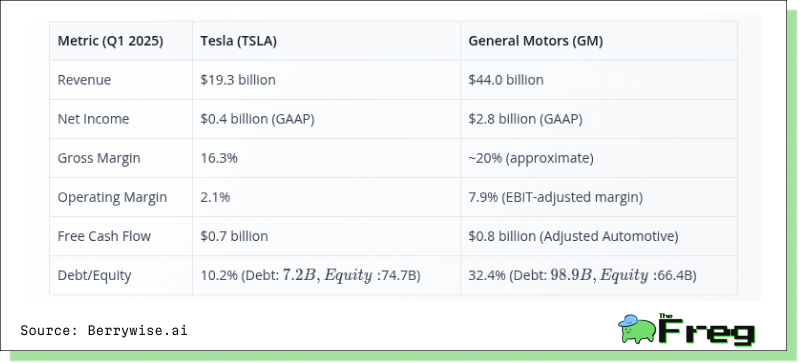
General Motors delivered significantly stronger top-line and bottom-line performance in Q1 2025, with revenue of $44.0 billion compared to Tesla’s $19.3 billion. GM also reported net income of $2.8 billion, far exceeding Tesla’s $0.4 billion, underscoring the benefits of GM’s diversified portfolio and scale.
Profitability metrics further highlight this gap. GM achieved an approximate gross margin of 20% and an EBIT-adjusted operating margin of 7.9%, while Tesla reported a gross margin of 16.3% and a much slimmer operating margin of 2.1%. Despite these differences, both automakers generated positive free cash flow—$0.8 billion for GM and $0.7 billion for Tesla—demonstrating solid cash management amid market challenges.
Balance sheet strength shows a sharp contrast. Tesla maintains a conservative debt-to-equity ratio of 10.2% with $7.2 billion in debt against $74.7 billion in equity, reflecting its net cash position. GM’s debt-to-equity ratio stands at 32.4%, driven by its $98.9 billion debt load tied to its automotive financing business. This highlights Tesla’s capital-light structure versus GM’s more leveraged, income-generating model.
Growth Drivers & Risks
Tesla
- Growth Catalysts:
- Expansion of affordable EV models.
- Energy storage scaling (Megapack).
- FSD/Robotaxi monetization.
- International expansion (China, Germany).
- Risks:
- Slowing delivery growth and market share erosion in key regions.
- Execution risk on new models, regulatory scrutiny.
- High valuation and volatility; institutional outflows.
General Motors
- Growth Catalysts:
- US truck/SUV dominance.
- Rapid EV sales growth (111% YoY in Q2 2025).
- New model launches, manufacturing investments.
- Partnerships (Uber, battery suppliers).
- Risks:
- Slower EV ramp vs. Tesla; ICE-to-EV transition risk.
- Regulatory and legal headwinds (data privacy lawsuits).
- Macro sensitivity, especially in the US consumer market.
Sector-Wide Risks:
- Interest rates, inflation, and consumer sentiment.
- Geopolitical tensions (China, EU tariffs).
- Supply chain disruptions (semiconductors, batteries).
Long-Term Performance & Risk Metrics
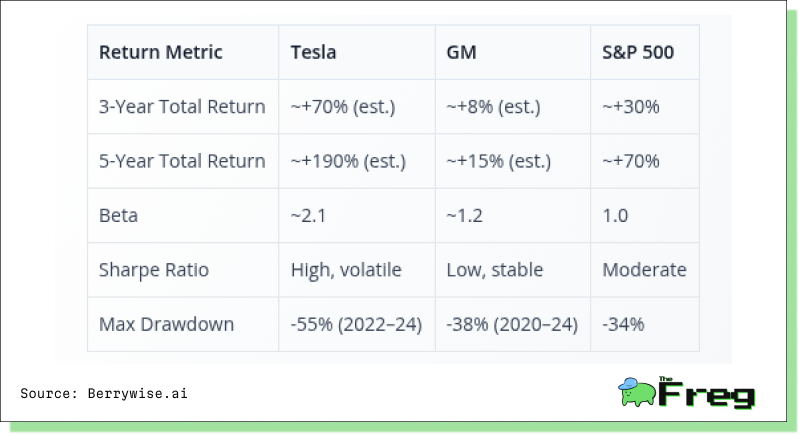
Tesla’s long-term performance metrics underscore its exceptional growth trajectory over the past five years, with an estimated 190% total return, far outpacing both GM and the S&P 500. However, this outperformance has come with substantially higher volatility—as reflected in a beta of approximately 2.1 and a maximum drawdown of 55%—making Tesla a high-risk, high-reward investment. Its high Sharpe ratio suggests strong risk-adjusted returns, but the path has been turbulent, with significant swings in investor sentiment.
GM, by contrast, has delivered modest but positive long-term returns, with a 15% gain over five years and 8% over three years, lagging the S&P 500 but providing a much smoother ride for shareholders. Its lower beta (~1.2) and smaller drawdowns highlight its defensive qualities and appeal to investors prioritizing stability and income. The company’s risk-adjusted returns are lower, but its performance has been more predictable, supported by steady cash flow and capital returns.
Overall, Tesla’s profile suits investors seeking aggressive growth and willing to accept high volatility, while GM is better aligned with those who value capital preservation, income, and lower risk—a distinction that remains critical as the automotive sector navigates ongoing transformation and macroeconomic uncertainty.
Forward Outlook & Guidance
Tesla
- Management expects a “return to growth” in deliveries, with 2025 revenue projected at $112B and upside from new models and FSD/AI.
- Macro sensitivity: Highly exposed to global EV demand, regulatory changes, and tech adoption.
- Outperformance hinges on successful rollout of affordable models and monetization of software.
General Motors
- Management guiding for continued volume growth, especially in EVs and full-size trucks/SUVs.
- 2025 consensus price target: $44–$51/share, reflecting moderate upside/downside.
- Macro sensitivity: US consumer market, regulatory climate for EVs, and legal risks.
- Outperformance depends on EV ramp, cost management, and successful product launches.
Conclusion
- Tesla offers superior growth prospects, technology leadership, and optionality in software/autonomous driving, but at a much higher valuation and risk profile. Best suited for growth-oriented investors willing to tolerate volatility and execution risk.
- General motors provides value, income (dividend/buybacks), and exposure to both ICE and EV markets. Its lower valuation and improving fundamentals appeal to income and defensive investors seeking stability and capital returns.


