


Fundamental Comparison of AutoNation and Gap Inc: Bifurcated Engines in U.S. Consumer Discretionary
From apparel aisles to showroom floors, Gap’s margin-driven revival and AutoNation’s cash-engine car empire tell two very different 2025 stories. Our comparative deep-dive weighs growth, leverage and catalysts—and crowns this cycle’s sturdier pick.

The U.S. consumer-discretionary complex enters 2025 stronger than feared: Americans kept spending through 2024 despite 5 %-plus policy rates, handing the sector market-beating gains. Macro visibility, however, remains cloudy—rate-cut timing, election-year policy and labour tightness will dictate the arc of demand. Autos and other big-ticket retailers stand to re-accelerate first if financing costs fall, while lower-income fashion spending stays highly selective.
Against this backdrop stand two scale leaders in separate specialty buckets. Gap Inc. (GAP) reported Q1-FY25 sales of $3.46 billion (+2 % YoY) and net income of $193 million—its ninth straight quarter of share gains—as e-commerce climbed to 39 % of revenue. AutoNation (AN) generated Q1-25 sales of $6.69 billion (+3 %) and net income of $176 million, fuelled by a 10 % surge in new-vehicle volumes even as used-car revenue softened.
The scorecard highlights divergent economics. Gap converts disciplined promotions and lean inventories into a 41.8 % gross margin and 7.5 % operating margin, finishing the quarter in a net-cash position of roughly $730 million. AutoNation operates on slimmer spreads—18.2 % gross and 5.0 % operating—but it converts 129 % of earnings to free cash and repurchased $225 million of stock in Q1, financed by floor-plan debt that lifts leverage to ~10× EBITDA.
Strategically, both are leaning hard into technology. Gap’s new Office of AI is sharpening assortment, pricing and supply-chain agility, while CEO Richard Dickson’s brand-reinvigoration playbook has dialed back blanket discounts. AutoNation’s Express digital storefront already sources 45 % of used-vehicle sales and, coupled with RepairSmith mobile service and densifying dealership clusters, is widening high-margin parts, service and finance profit pools.
Guidance reflects DNA. Gap targets 1–2 % FY-25 sales growth and further margin expansion, with tariff relief and an Athleta reset as upside triggers. AutoNation eyes mid-single-digit top-line growth anchored in SAAR resilience and captive-finance penetration, but pricing normalisation could cap new-car spreads. Bottom line: Gap offers recovering margins, net-cash optionality and lower beta; AutoNation delivers superior free-cash yield and structural buyback power at the cost of higher leverage and cyclicality—two contrasting yet compelling ways to play a still-resilient U.S. consumer.
Consumer Discretionary Sector - The Strategic Positions of The GAP and AutoNation
The Consumer Discretionary sector - home to businesses that sell non-essential goods and services such as apparel, automobiles, hotels and home-improvement supplies—has entered 2025 from a position of surprising resilience. U.S. consumers kept spending through 2024 despite higher rates and inflation, giving the sector “market-beating gains”; yet macro cross-currents (labour markets, rate-cut expectations, and potential election-year policy shifts) remain the key swing factors for 2025. Within the sector, performance diverges sharply by industry: auto-related names and home-improvement retailers stand to rebound first if borrowing costs ease, while lower-income segments may still pare back discretionary purchases.
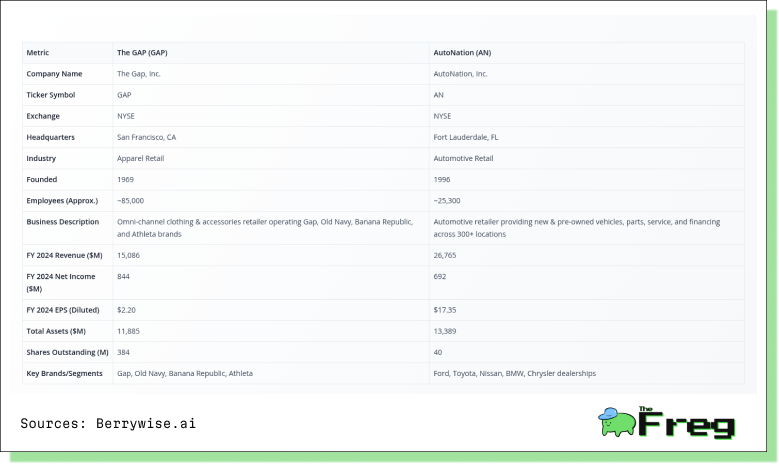
Gap Inc. (“The Gap”) is a multi-brand specialty apparel retailer (Old Navy, Gap, Banana Republic, Athleta) whose FY-2024 sales rebounded to $15.1 billion and whose first-quarter-2025 turnaround produced $3.46 billion revenue and $193 million net income. The company operates ≈2,506 company-run stores and employs ≈82,000 people, with a $8 billion market capitalization as of 24 June 2025.
AutoNation is the largest U.S. automotive retailer. FY-2024 sales were $26.9 billion and Q1-25 revenue reached $6.69 billion with $176 million net income. It runs 322 new-vehicle franchises in 244 physical stores plus 26 AutoNation USA used-vehicle outlets, employs ≈25,100 associates, and is valued at $7 billion.
Sector Structure
Under the Global Industry Classification Standard (GICS), Consumer Discretionary splits into four industry groups; GAP and AutoNation both sit in “Consumer Discretionary Distribution & Retail” but in different specialty buckets:
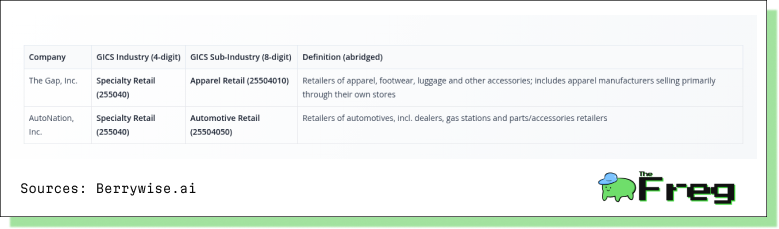
Comparative overview - The GAP Inc. vs AutoNation
Both industries face common challenges stemming from broader economic uncertainties and evolving consumer behaviors. The consumer discretionary sector overall confronts pressures from potential tariff policies, with 29% of consumers citing tariff concerns as a top worry following inflation. These concerns are particularly relevant for companies like GAP, which relies heavily on international supply chains and manufacturing.
The apparel retail sector specifically struggles with volume contractions across discretionary products, as consumers become increasingly diligent in seeking sales and promotions while trading down to lower-priced brands. McKinsey research indicates that 27% of consumers plan to reduce fashion purchases, while the industry grapples with excess inventory levels and the need for sustainable practices.
Conversely, the automotive retail sector benefits from more resilient demand patterns, though it faces its own set of challenges including the transition to electric vehicles, changing financing conditions due to interest rate fluctuations, and evolving consumer preferences toward online purchasing experiences. AutoNation's diversified revenue streams through financing, insurance, and after-sales services provide some insulation against these market pressures.
Company Overviews -
The GAP Inc. & AutoNation
The GAP operates as the largest specialty apparel retailer in America, with a 55+ year history in fashion retail. The company generates revenue through its portfolio of iconic brands across multiple channels including physical stores, e-commerce, and franchise operations.
AutoNation stands as America's largest automotive retailer, managing over 300 locations primarily in major metropolitan markets across the Sunbelt region. Founded by Wayne Huizenga, the company provides comprehensive automotive services including vehicle sales, financing, parts, and service operations.
While AutoNation generates significantly higher revenue ($26.8B vs $15.1B), GAP maintains a higher net profit margin and employs substantially more people across its retail operations. AutoNation's higher EPS reflects its more concentrated share structure with only 40 million shares outstanding compared to GAP's 384 million shares.
Strategic Positioning and Market Dynamics - Industry Context
The consumer discretionary sector faces multiple headwinds including tariff impacts, with 29% of consumers citing tariff concerns as a top worry. GAP has implemented comprehensive mitigation strategies, reducing estimated tariff impact from $250-300 million to $100-150 million through supply chain diversification and increased U.S. cotton sourcing. The apparel retail industry confronts volume contractions, with 27% of consumers planning to reduce fashion purchases while increasingly seeking sales and promotions. Conversely, the automotive retail sector benefits from improved vehicle inventory and 15.5 million units sold in 2024, marking an 11.6% increase. McKinsey research indicates that 74% of consumers prefer brands with sustainable practices, while 63% shop online at least once weekly. This trend particularly benefits GAP's omnichannel strategy and AutoNation's digital platform development.
The Gap (GAP): Flag-Bearer of U.S. Apparel Retail
The Gap Inc. operates as the fourth-largest apparel retailer globally with approximately 85,000 employees across its portfolio of brands including Old Navy, Gap, Banana Republic, and Athleta. The company commands a 4.7% market share in the highly fragmented $1.84 trillion global apparel retail market, which faces headwinds from sustainability demands and fast fashion competition.
Scale & Reach
Fiscal 2024 net sales reached $15.1 billion, up 1 % YoY despite a 53-week prior year. Operates 2,506 company-owned stores plus ~1,000 franchise doors across 40 countries, under Old Navy, Gap, Banana Republic and Athleta banners.
Competitive Role
Old Navy reclaimed the title of “#1 specialty apparel brand and retailer in the U.S.” after consistent comp gains and market-share wins in 2024. The namesake Gap brand posted its sixth straight quarter of positive comps and eighth quarter of share gains, signalling a successful reinvigoration strategy. The portfolio’s omnichannel capabilities (BOPIS, ship-from-store, mobile) and shared supply-chain platform underpin cost leverage and speed-to-market.
Strategic Importance to Industry
Gap’s breadth—value (Old Navy), mid-market (Gap), premium lifestyle (Banana Republic) and women’s performance (Athleta)—gives it a unique barometer on U.S. apparel demand. Its market-share momentum and store rationalisation program set the playbook many smaller specialty retailers emulate.
AutoNation (AN): Scale Leader in U.S. Automotive Retail
AutoNation Inc. stands as America's largest automotive retailer, managing over 300 locations across 17 states with approximately 25,300 employees. The company maintains a 2.1% market share in the $3.92 trillion global automotive retail market, which benefits from a more favorable 7.15% CAGR growth trajectory through 2032.
Scale & Footprint
As of 31st March 2025, AutoNation owned 322 new-vehicle franchises across 244 stores in major Sunbelt metros, selling 30 brands. The platform extends to 52 collision centres, 26 AutoNation USA used-vehicle super-stores and a captive finance arm, giving unrivalled vertical integration.
Financial Muscle
Q1-2025 revenue printed $6.7 billion with record gross profit and >140 bp margin expansion YoY. The company repurchased $225 million of stock in the quarter, reflecting strong free-cash conviction and balance-sheet flexibility.
Industry Role
AutoNation is widely cited as “one of the largest automotive retailers in the United States,” leveraging national scale for inventory, digital retailing and finance penetration advantages. Its diversified revenue mix—new cars (49 %), used cars (29 %), parts & service (17 %) and F&I (5 %)—positions it as a bellwether for U.S. auto demand and dealership profitability trends.
Strategic Transformation Through Innovation and Digitization
The American Consumer Discretionary arena is bifurcating: value-seeking households remain price sensitive, while higher-income cohorts continue to spend on vehicles and lifestyle brands. The Gap Inc. (“Gap”) and AutoNation Inc. (“AutoNation”) have responded with sharply different—but equally purposeful—strategy playbooks that are already visible in their Q1 FY-25 financial prints.
Both companies have embraced comprehensive transformation strategies that extend far beyond traditional retail approaches, positioning themselves as technology-forward organizations capable of navigating the sector's evolving dynamics by executing comprehensive digital transformation strategies that extend beyond traditional retail approaches. GAP established an Office of AI dedicated to driving monetization opportunities across customer experience, product development, and organizational productivity, while AutoNation deployed its proprietary AutoNation Express platform enabling complete digital vehicle transactions.
Strategic levers - The GAP Inc. (GAP)
- Brand-reinvigoration playbook - Under CEO Richard Dickson, Gap has pivoted from blanket promotions to cultural storytelling—reviving iconic campaigns and refining in-store signing to “stop bombarding customers” with discounts.
- Portfolio-specific merchandising - Old Navy (+3 % comps) and Gap Global (+5 %) continue to win share; Athleta is being “reset” after an 8 % comp decline.
- Omnichannel & supply-chain efficiency - Shared inventory platforms, BOPIS and ship-from-store underpin the 60 bp ROD leverage in Q1.
- Capital discipline - 4 m shares were repurchased ($70 m) and the dividend maintained, while FY25 guidance still assumes ~35 net store closures to concentrate traffic.
Take-away
The margin expansion in Q1 validates the brand-centric strategy: fewer promotions and tighter inventory are translating into higher merchandise margins and lower occupancy drag. GAP's brand reinvigoration strategy has generated nine consecutive quarters of market share gains, with CEO Richard Dickson describing the shift from "fixing fundamentals" to "continuous improvement through innovation" . The company's digital sales now represent 39% of total net sales, growing 6% year-over-year .
Strategic levers - AutoNation (AN)
- Market-densifying acquisitions - In April 2025 AutoNation bought Groove Ford & Mazda, adding ~$219 m revenue and 200 staff to its Denver cluster—an explicit “density” play for scale synergies.
- AutoNation USA used-vehicle rollout - Management targets 20 stand-alone stores by 2027 to capture high-velocity pre-owned demand, a pivot reinforced by a 13 % YoY rise in used-vehicle gross profit per unit.
- Digital retail leadership - Almost 45 % of used-car sales now originate online via AutoNation Express, delivering a seamless click-to-store journey and higher lead conversion.
- After-Sales & mobile repair - The earlier RepairSmith acquisition gives AutoNation a mobile service flank—supporting the $568 m record parts & service profit and smoothing cyclicality.
- Shareholder returns - Q1 buybacks of $225 m at ~$165/shr evidence confidence and offset EPS dilution from margin normalization.
Take-away
AutoNation is using balance-sheet firepower to thicken high-margin revenue streams (After-Sales, F&I) and cement a digital-first dealership model—mitigating new-car margin compression while keeping EPS on an upward glide-path. AutoNation's technology infrastructure, supported by Customer 360 CRM and Equity Mining Tool, has enabled 45% of sales to occur online, contributing an additional 1,200-1,600 vehicles sold monthly . The company's focus on after-sales services has generated record gross profit of $568 million in Q1 2025.
Q1 2025 - Scorecard of The GAP Inc. and AutoNation
Our Take
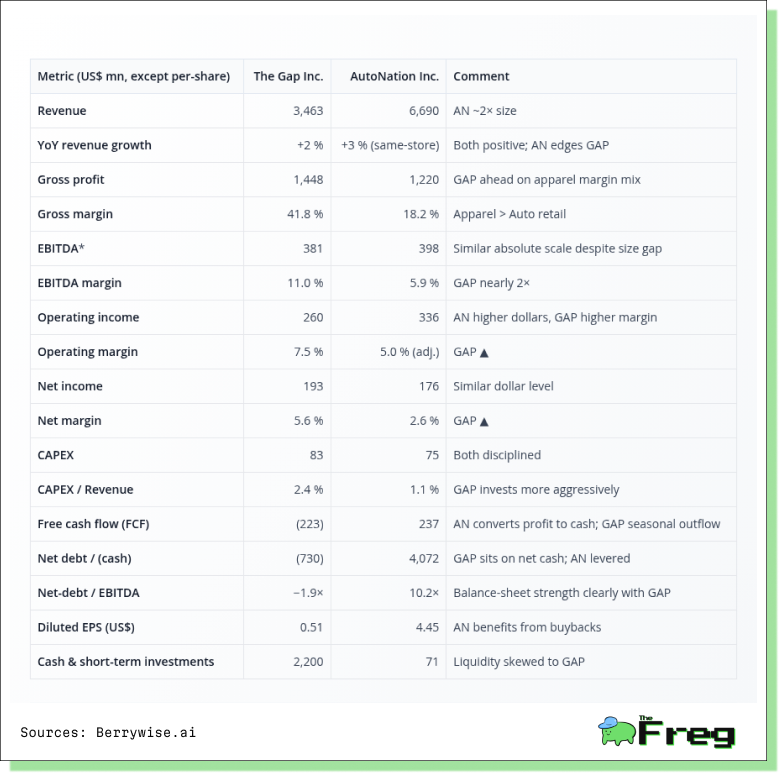
Q1 results reinforce each company’s strategic identity—Gap as a margin-driven, cash-rich apparel platform and AutoNation as a scale-powered, cash-flow machine in auto retailing.
Scale vs. Margin Trade-Off
AutoNation generated nearly double Gap’s revenue (US $6.7 bn vs. US $3.5 bn), yet Gap produced the higher gross (41.8 %) and EBITDA (11 %) margins. Apparel’s asset-light model and disciplined promotions trumped the inherently slimmer spreads of auto retailing.
Earnings Quality & Mix
Gap’s margin gains flowed through to a 5.6 % net margin, more than double AutoNation’s 2.6 %. Meanwhile, AutoNation still converted a similar absolute dollar profit—showing that scale can compensate for lower unit economics.
Cash-Flow Divergence
Seasonality drove Gap to a negative free-cash-flow quarter, whereas AutoNation produced positive FCF and channelled it into US $225 m of share buybacks. This underscores the dealership model’s cash generative power even in a normalizing margin environment.
Balance-Sheet Contrast
Gap sits in a net-cash position (~US $730 m), giving management optionality for dividends or buybacks if demand softens. AutoNation carries leverage of roughly 10× EBITDA—typical for floor-plan-financed retailers but a watch-point should vehicle volumes crack.
Capital Discipline Maintained
Both companies kept capex below 3 % of sales, signalling tight capital allocation while macro visibility remains cloudy.
Strategic Alignment Evident in Numbers
Gap’s promo pull-back and inventory control directly lifted gross margin, validating the brand-led strategy. AutoNation’s densification acquisitions and digital sales push fed higher after-sales and finance income, cushioning thinner new-car margins.
Shareholder-Return Posture
Heavy repurchase activity at AutoNation (and lighter but ongoing buybacks at Gap) indicate confidence in intrinsic value and earnings durability, albeit from very different leverage bases.
Risk-Reward Skew
Investors get higher operating leverage and margin stability with Gap, balanced against apparel-cycle risk. AutoNation offers larger absolute cash flows and exposure to rate-sensitive auto demand but at the cost of greater financial leverage.
Revenue Segment Analysis
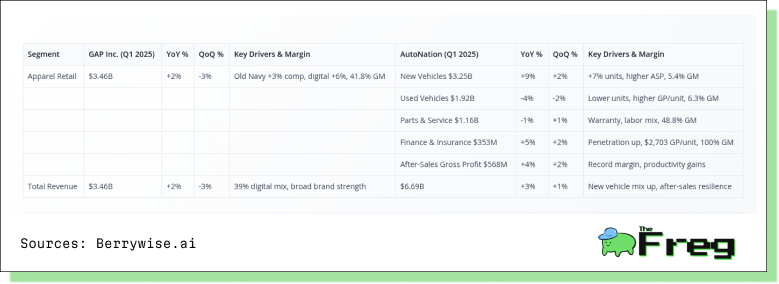
- GAP operates a single apparel segment with 41.8% gross margin; AutoNation has four diversified segments.
- AutoNation's Parts & Service delivers the highest margin at 48.8% vs. new vehicles at 5.4%.
- GAP's digital sales reach 39% of revenue; Old Navy drives growth with +3% comparable sales.
- AutoNation's Finance & Insurance segment shows 100% gross margin, highlighting auxiliary service profitability.
- Both companies achieve similar growth rates (GAP +2%, AutoNation +3%) through different business models.
Geographic Revenue Distribution
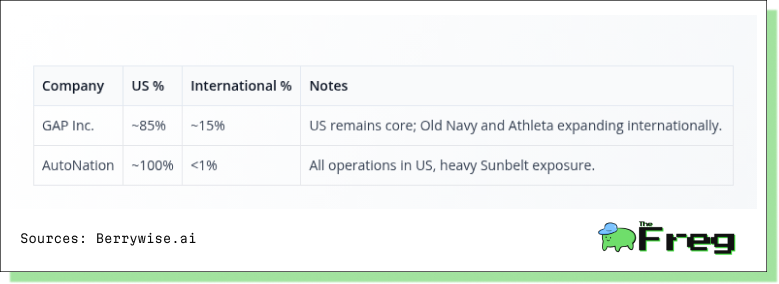
- GAP maintains modest international diversification at 15% vs. AutoNation's pure U.S. focus.
- AutoNation's Sunbelt concentration aligns with demographic growth trends.
- GAP's international exposure provides currency hedging and growth optionality.
- AutoNation faces higher domestic economic cycle exposure but benefits from market expertise.
Expenses and Operational Efficiency
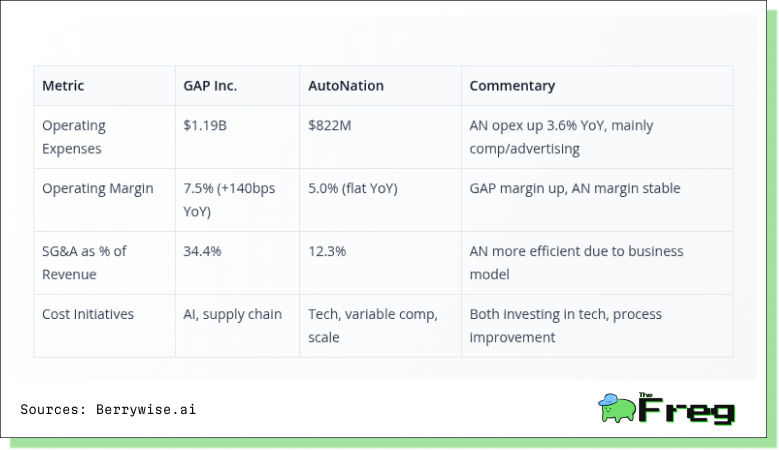
- GAP achieves significant margin expansion (+140bps) vs. AutoNation's stable margins.
- AutoNation's 12.3% SG&A ratio demonstrates superior operational efficiency vs. GAP's 34.4%.
- Both companies invest in technology, but GAP focuses on AI and supply chain optimization.
- GAP's higher SG&A reflects labor-intensive apparel retail models.
- AutoNation benefits from higher-value transactions and lower inventory turnover requirements
Balance Sheet and Cash Flow
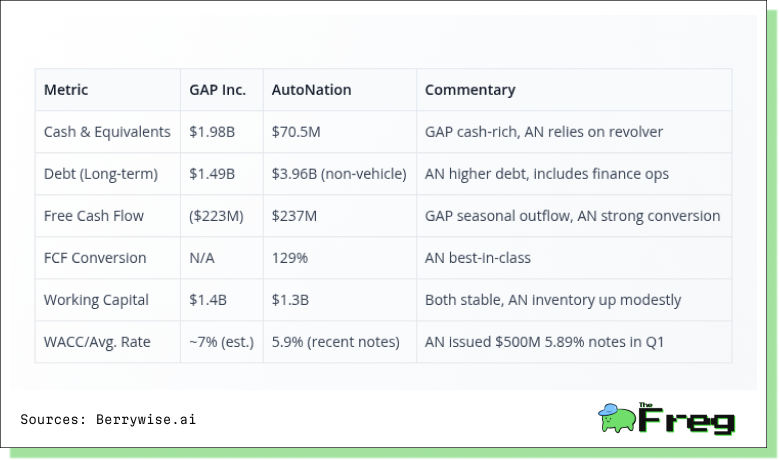
- GAP maintains substantial cash reserves ($1.98B) vs. AutoNation's lean approach ($70.5M).
- AutoNation achieves exceptional 129% free cash flow conversion despite higher debt load.
- GAP's negative FCF reflects seasonal working capital patterns in apparel retail.
- AutoNation's $3.96B debt supports financing operations and growth initiatives.
- AutoNation's lower borrowing costs (5.9%) reflect strong creditworthiness.
Capital Allocation and Shareholder Returns
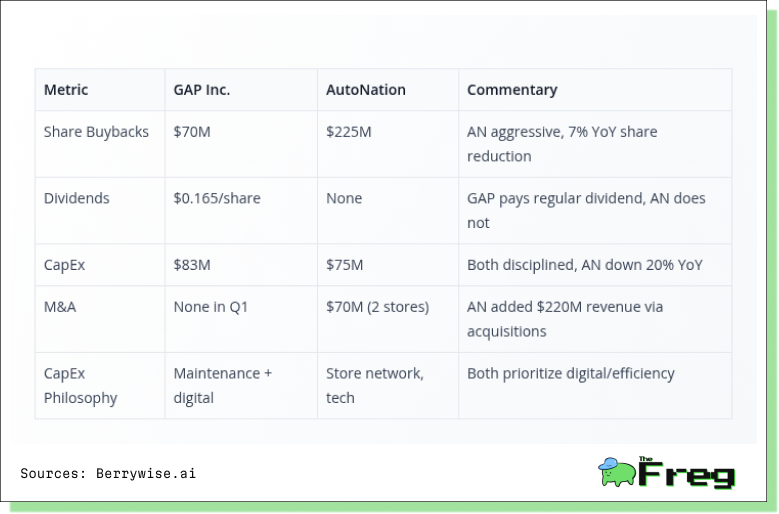
- AutoNation pursues aggressive buyback strategy ($225M) achieving 7% share count reduction.
- GAP balances dividends ($0.165/share) with moderate buybacks ($70M).
- AutoNation's M&A activity generates attractive revenue multiples ($220M revenue from $70M investment).
- Both companies maintain disciplined CapEx focused on digital infrastructure.
- Contrasting approaches: GAP emphasizes income return, AutoNation maximizes EPS accretion.
Forward Guidance
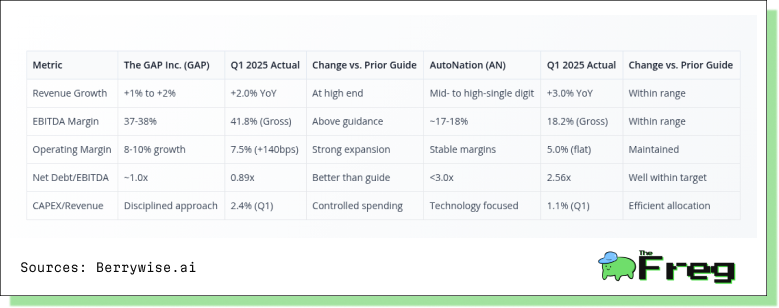
GAP demonstrates superior operational leverage execution, achieving the high end of its 1-2% revenue growth guidance at +2.0% year-over-year while delivering exceptional margin expansion of 140 basis points to 7.5% operating margin. This performance validates management's strategic focus on brand reinvigoration and operational efficiency during the company's ninth consecutive quarter of market share gains.
AutoNation maintains disciplined growth within guided parameters, delivering +3.0% revenue growth that falls comfortably within its mid- to high-single digit guidance range. The company's ability to achieve record after-sales gross profit of $568 million while maintaining stable operating margins at 5.0% demonstrates the resilience of its diversified business model.
Both companies exceed guidance expectations on key profitability metrics, with GAP's gross margin of 41.8% surpassing its 37-38% EBITDA margin guidance and AutoNation's 18.2% gross margin performing within the targeted 17-18% range. This indicates effective cost management and pricing discipline across both retail models, while delivering solid revenue growth in Q1 2025, with GAP achieving the high end of its 1-2% guidance range at +2.0% year-over-year growth. AutoNation's +3.0% growth reflects strong performance driven by new vehicle sales growth of +7% on a same-store basis. GAP's performance was particularly notable given the challenging retail environment, marking its ninth consecutive quarter of market share gains.
Key Takeaways
Thesis at a glance: Gap offers a classic turnaround play—brand clean-up, margin restoration, low leverage—while *AutoNation* is a cash-engine compounder scaling captive finance but carrying heavier debt and less margin headroom.
Earnings momentum: Gap’s 1Q-25 operating margin expanded +140 bp to 7.5 % on flat-to-low-single-digit sales; AutoNation grew revenue slightly faster (+3 %) yet saw margin slip -20 bp to 5.0 % as new-vehicle gross profit per unit compressed.
Growth durability: Gap’s upside hinges on Old Navy and core Gap (+3 % and +5 % respectively) stabilising Banana Republic/Athleta; category demand and tariff noise remain wildcards. AutoNation’s volume tailwind rests on import & luxury (+3 %/+7 %), plus a captive-finance flywheel now profitable—but unit economics are sensitive to price-cut cycles.
Balance-sheet safety: Gap sits on \$2.2 bn cash vs. \$1.5 bn low-rate debt (net cash ex-leases), buying it runway for store rationalisation. AutoNation holds only \$70 m cash against \$4.0 bn 5.9 % debt—manageable today via robust free cash flow, but exposed to rate shocks.
Cash-flow & payout: Gap posted seasonal FCF of –\$140 m yet maintains a 3 % forward dividend yield and resumed buybacks (\$70 m). AutoNation converts 129 % of net income to FCF and ploughs nearly all of it into repurchases (\$225 m YTD) with no dividend.
Catalysts & valuation skew: Gap guides FY-25 sales +1–2 % and EBIT +8–10 %; successful Athleta turnaround or tariff relief could unlock multiple re-rating. AutoNation’s near-term catalysts are SAAR resilience, continued finance penetration, and dealership bolt-ons, but higher rates and margin pressure could cap valuation upside.
Risk-reward call: Investors seeking recovering margins and balance-sheet optionality may lean toward Gap; those favouring steady cash yield via aggressive buybacks, accepting higher leverage and margin volatility, may prefer AutoNation.
Given its net-cash position, expanding margins, and greater balance-sheet optionality, Gap presently exhibits the sturdier financial footing and fundamentals, whereas AutoNation’s superior cash generation is offset by higher leverage and margin volatility.
Performance Analysis - GAP vs AN vs SPX
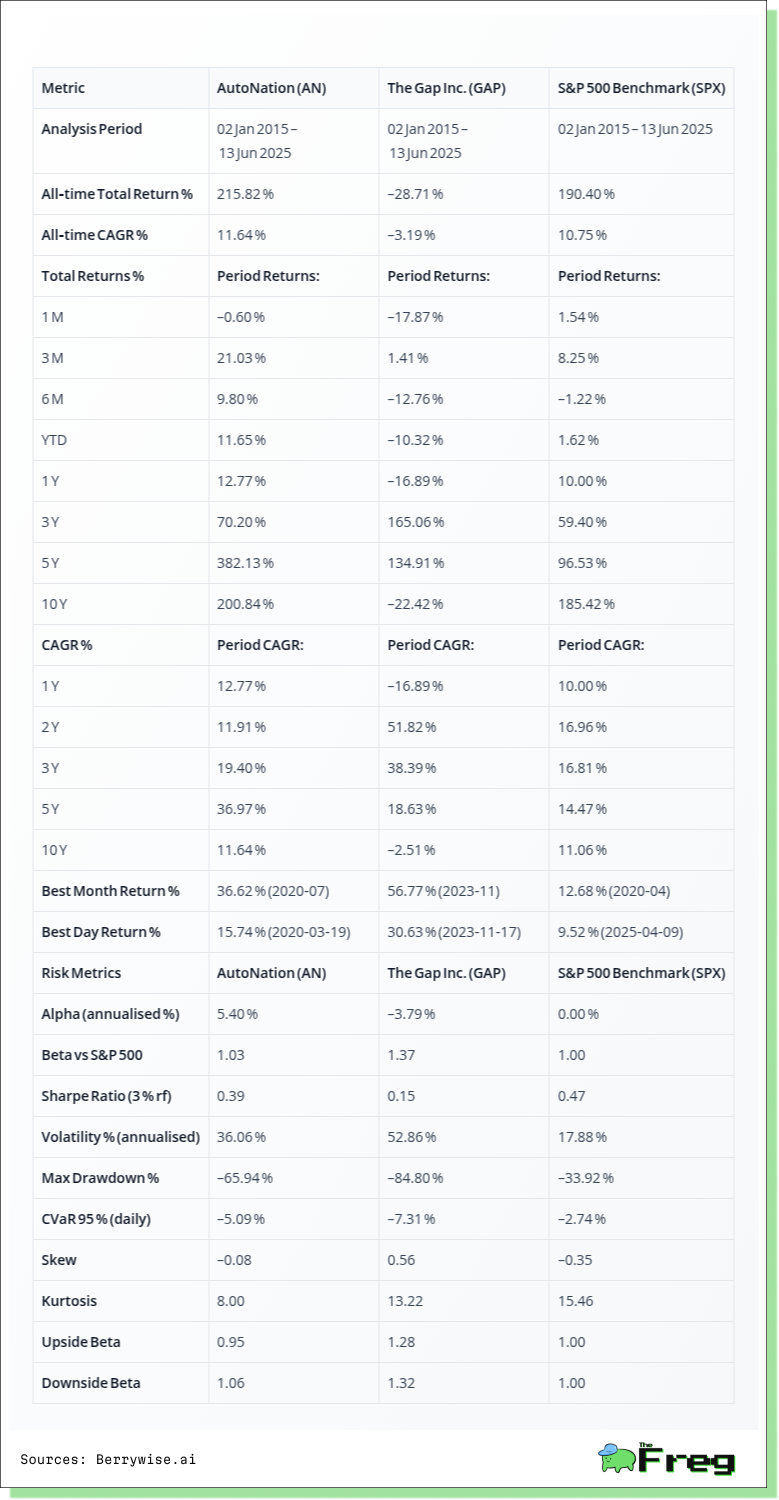
AutoNation (AN) has outperformed decisively, delivering a 216 % total return (11.6 % CAGR) since 2015, driven by a 382 % surge over the last five years, boosted by strong vehicle margins and aggressive buybacks. The stock remains strong: +12.8 % year-on-year, +21 % over the last quarter, despite low-double-digit YTD gains amid volatility. Major rallies during supply-constrained periods—July 2020 (+36.6 %) and March 2020 (+15.7 % in a day)—highlight its operating leverage.
Gap Inc. (GPS) is a turnaround story. Despite a decade-long –22 % drawdown, it surged 165 % over the past three years as leadership revamped banners and rationalised stores. Recent missteps, however, pushed returns down: –17 % over 12 months and –10 % YTD. Still, November 2023’s 56.8 % spike and a 30.6 % one-day jump reveal its potential for sharp re-ratings. For comparison, the S&P 500 has posted a steady 190 % return (10.8 % CAGR) since 2015, with modest volatility.
AN’s cyclicality is well-priced. Beta is 1.03, with a solid 5.4 % annualised alpha and a Sharpe ratio of 0.39, efficiently converting 36 % volatility into excess returns. Downside beta (1.06) closely matches upside (0.95), showing balanced cycle participation.
Gap shows higher volatility (53 %) and episodic rallies (positive skew 0.56) but delivers poor risk-adjusted returns: –3.8 % alpha, Sharpe ratio 0.15, and a deep –85 % max drawdown. Sustainable inventory control and margin improvements are critical to reducing its financing and execution risks.
AN offers proven long-term growth with well-compensated risk. Gap, though capable of explosive rallies, remains a speculative play needing sustained operational discipline before risk-adjusted returns can rival market benchmarks.
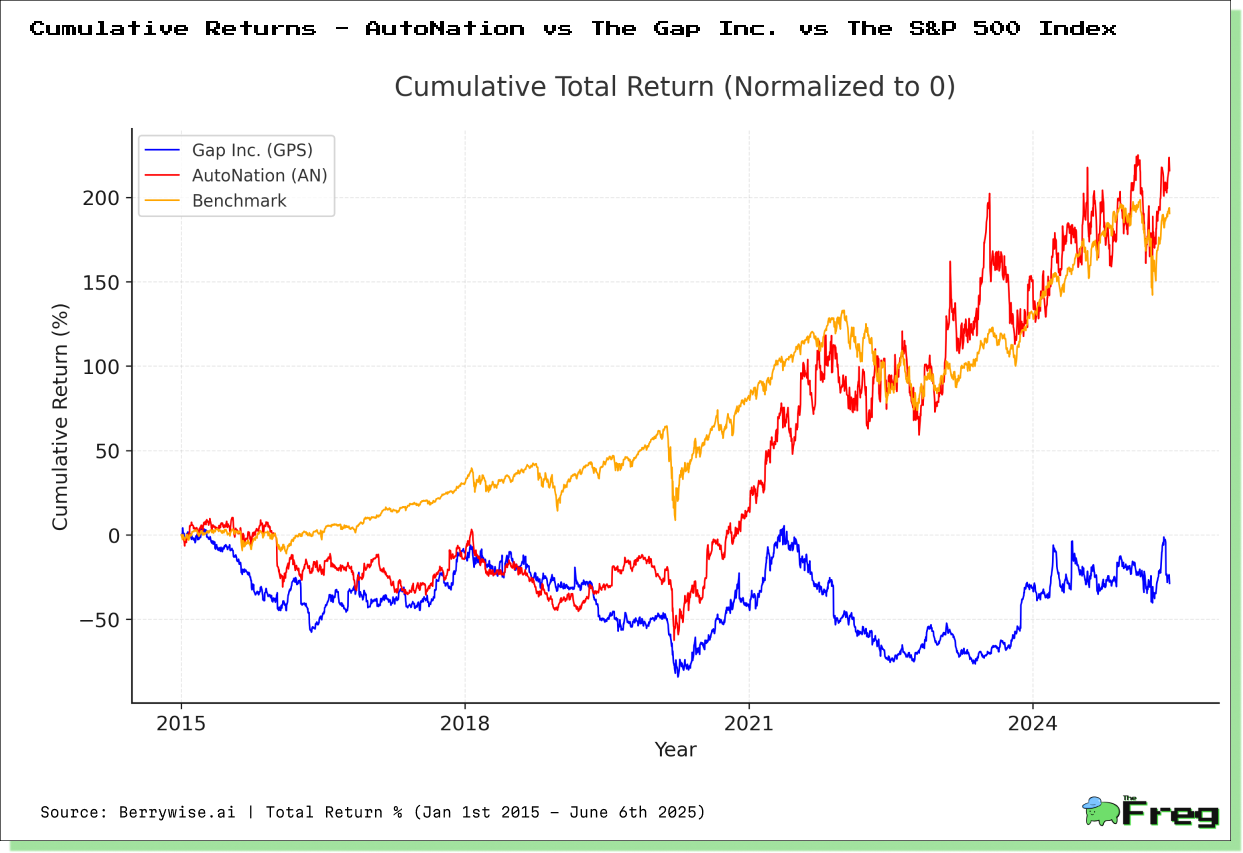
AutoNation's superior wealth creation, achieving cumulative returns significantly above both The Gap Inc. and the S&P 500 benchmark reflects the company's successful execution in the automotive retail sector, benefiting from industry consolidation and operational improvements. The Gap Inc.'s Underperformance: illustrates the challenges facing traditional brick-and-mortar retail, with Gap's returns lagging both the automotive retail peer and broad market index. This reflects secular headwinds including e-commerce disruption and changing consumer preferences.
The visualization reveals distinct volatility patterns and risk characteristics across the positions. AutoNation demonstrates higher absolute volatility but superior risk-adjusted returns, while Gap exhibits significant downside deviation from the benchmark with limited upside capture. The analysis highlights sector-specific dynamics and company execution differentials. AutoNation's performance reflects successful adaptation to industry trends, while Gap's trajectory indicates ongoing structural challenges in traditional retail markets.
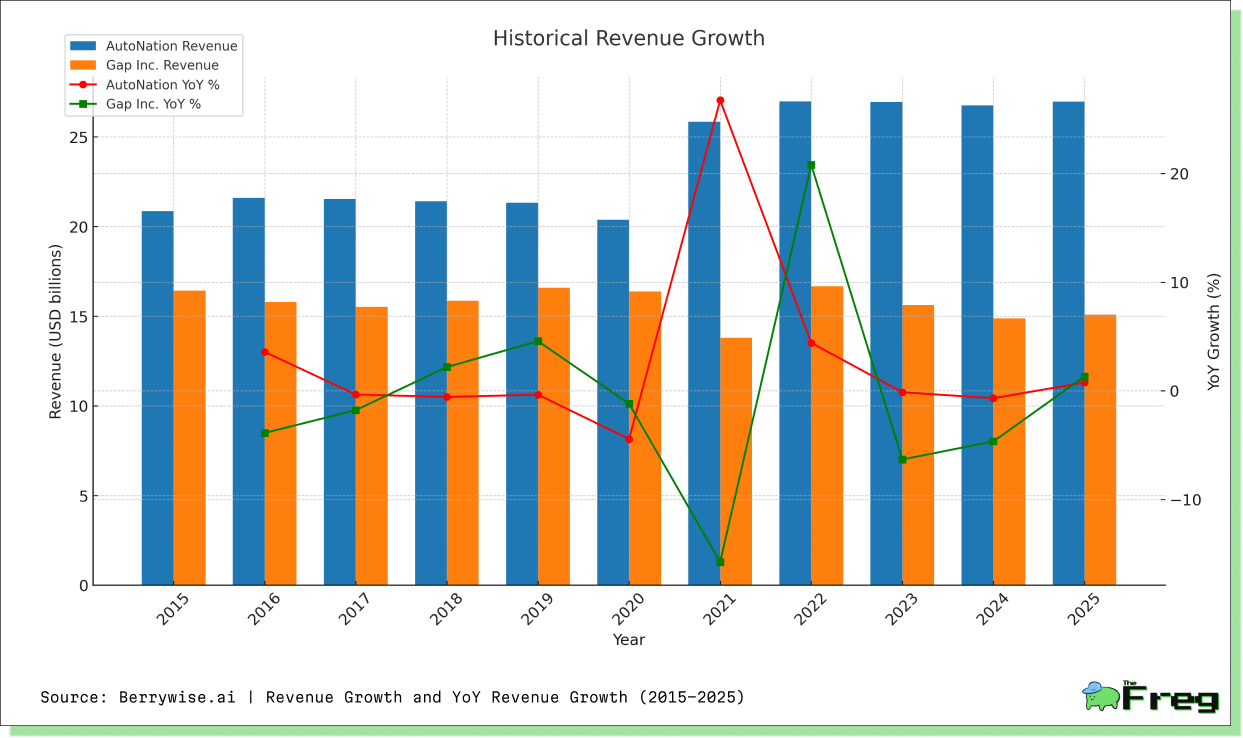
Long-term Performance
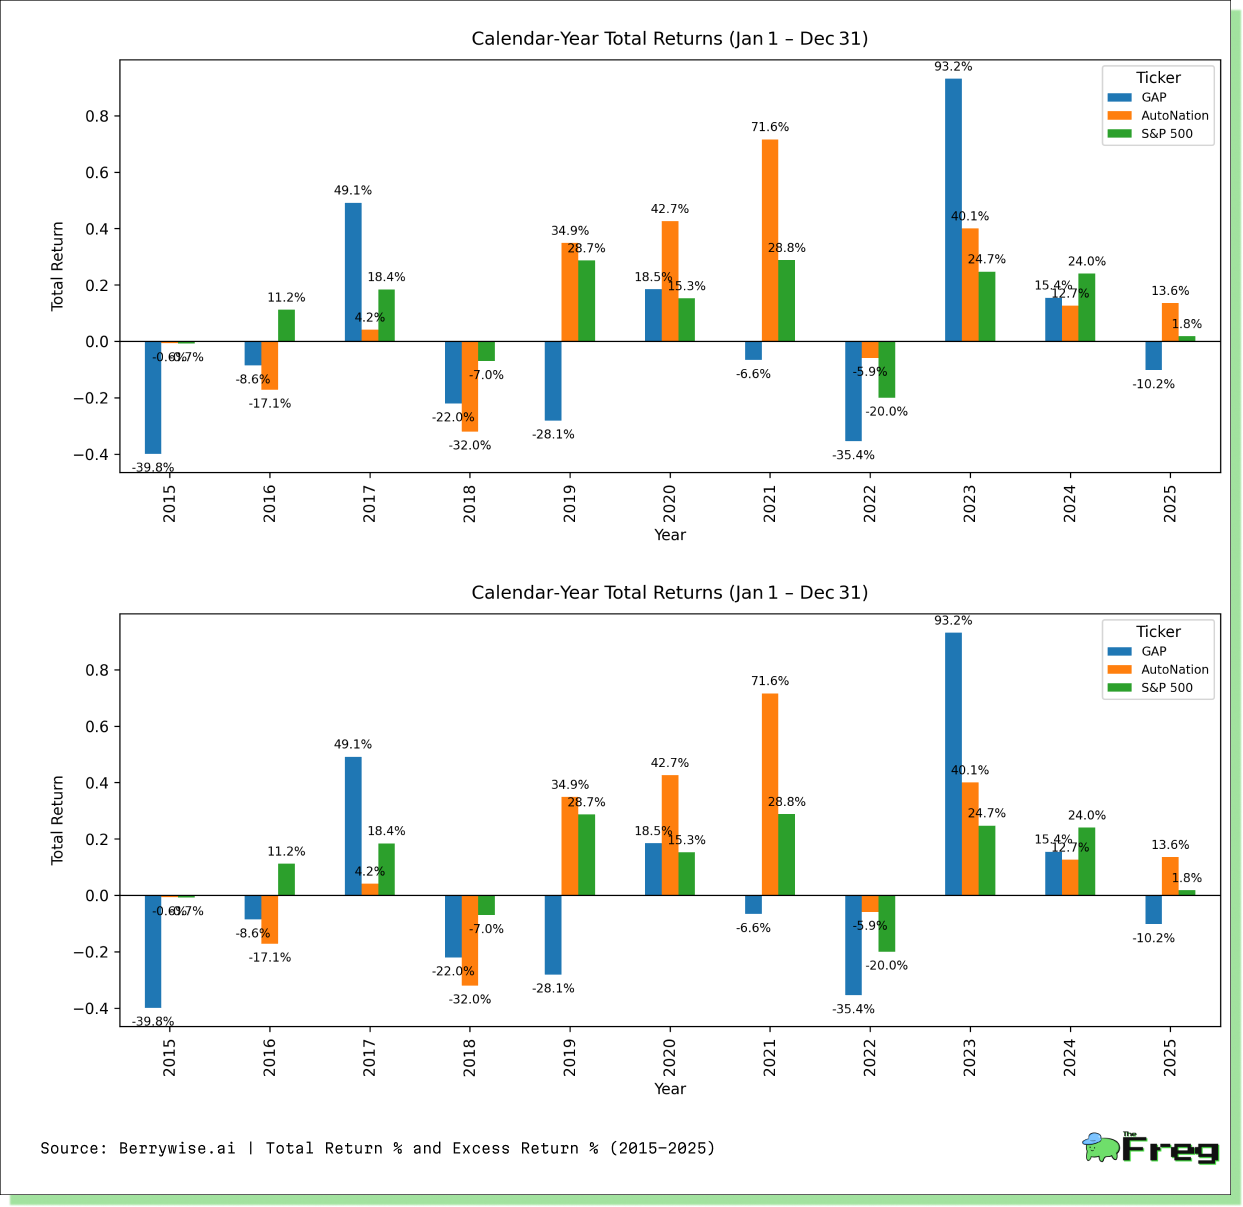
Gap’s share performance has been highly erratic: deep drawdowns in 2015 (-40 %) and 2022 (-30 %) were punctuated by powerful rebounds in 2017 (+49 %) and 2023 (+93 %), yet the stock lagged the S&P 500 in seven of the last ten calendar years. AutoNation, by contrast, delivered steadier compounding and beat the index in six of those ten years, with a standout 2021 (+72 % vs. +29 % for the benchmark) on robust used-vehicle demand. The excess-return chart underscores AN’s superior execution and more resilient fundamental backdrop, while Gap’s turnaround momentum remains episodic.
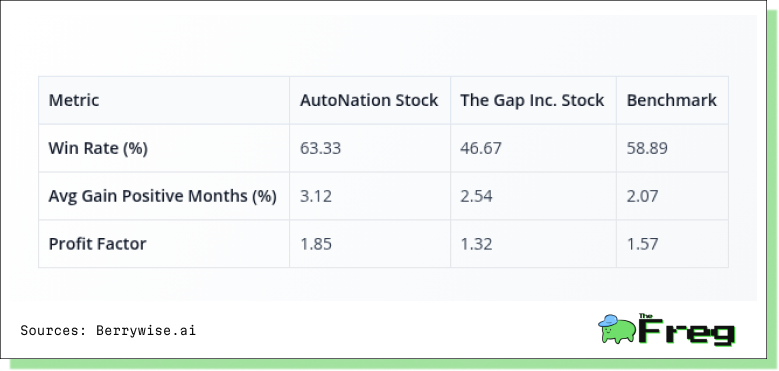
AutoNation exhibits a robust monthly win rate of 63.33%, comfortably above the S&P 500’s historical positive‐month frequency of roughly 59%. Its average gain in winning months of 3.12% outpaces the benchmark’s 2.07%, and a profit factor of 1.85 means it generates $1.85 for every dollar lost during down months. In contrast, Gap’s retail‐driven volatility delivers a sub-50% win rate of 46.67%, reflecting the declining reliability of “Sell in May and go away” seasonal effects in 2025. Its lower profit factor of 1.32 underscores margin compression from heavy discounting and tariff uncertainty. The benchmark’s 58.89%-win rate aligns with long-term averages and a profit factor of 1.57 highlights diversified resilience. Sector rotation—favoring cyclical auto dealers over discretionary apparel amid macro headwinds—is a key driver of these disparities. Seasonal tailwinds like the “Santa Rally” (avg. 1.6% December gain) have offered scant lift to Gap, illustrating how structural inventory resets can overwhelm calendar patterns.
Risk Analysis: AutoNation (AN) vs The Gap Inc. (GAP) vs
S&P 500 Index
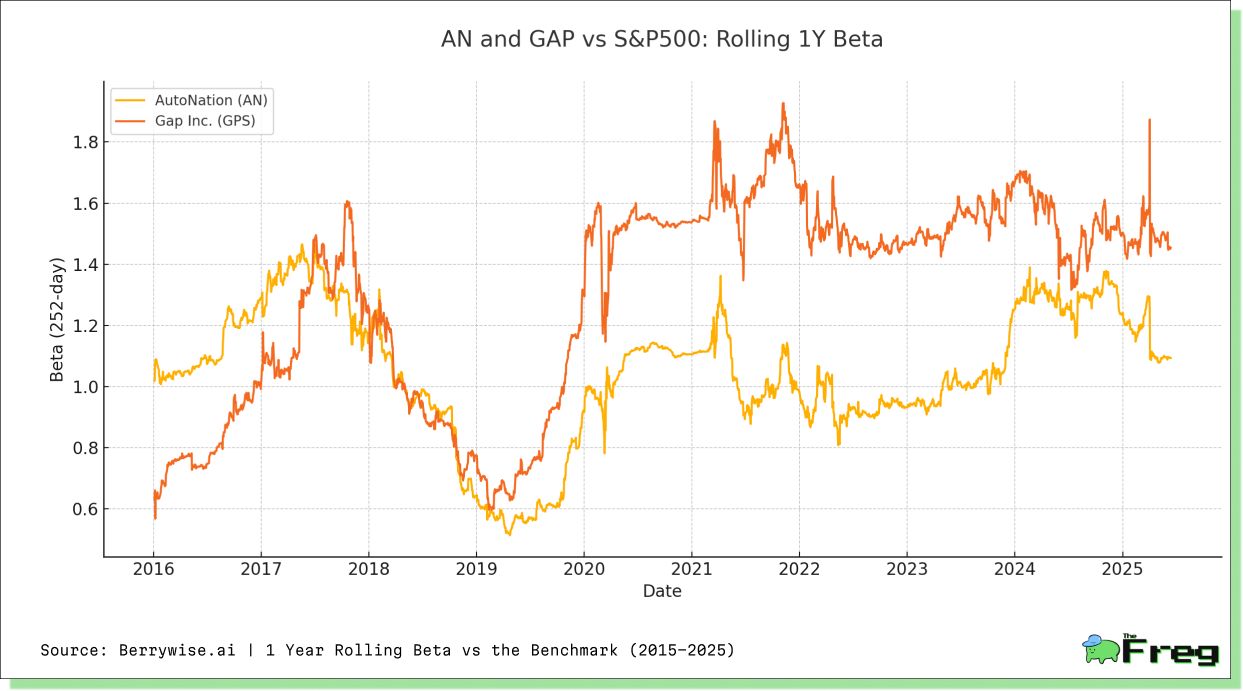
AutoNation’s beta has oscillated around 1.0 for most of the past decade, signalling that its share price generally moves in line with the S&P 500 but with modest cyclical amplification. Periods of heightened operating leverage—most visibly during the 2017-18 used-car volume boom and the post-COVID inventory squeeze—pushed beta as high as ~1.3-1.4, yet subsequent supply-chain normalisation drew it back toward the market.
Gap Inc. displays a structurally higher risk profile. Its rolling beta climbed steadily above 1.5 after 2019 as fashion volatility, e-commerce share loss, and margin pressure made earnings more sensitive to macro swings. Spikes beyond 1.8 coincide with merchandising missteps and capital-structure uncertainty, underscoring the stock’s vulnerability to sentiment shifts.
Overall, investors are compensated with greater upside—but also sharper drawdowns—for owning Gap relative to AutoNation, reflecting divergent competitive moats and cash-flow stability.
Volatility and Correlation Analysis: AutoNation (AN) vs The Gap Inc. (GAP) vs S&P 500 Index
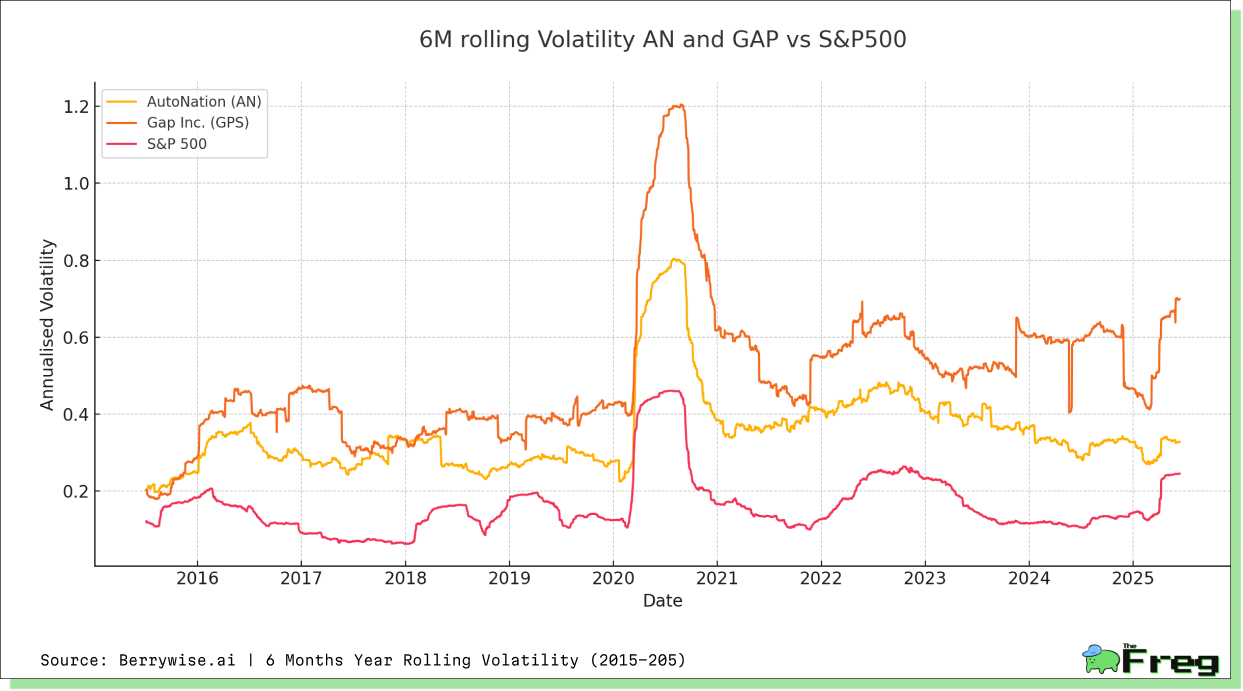
Both stocks spiked to crisis-level vol in March-April 2020 as COVID shuttered dealerships and apparel stores: six-month annualised vol peaked near 120 % for Gap and ~80 % for AutoNation, triple the S&P 500’s own surge. Gap remained the more jittery name through the re-opening phase; its vol reheated in 2H 2021 when port congestion and Vietnam factory shutdowns forced management to warn of a potential $550-$650 million sales hit and expensive air-freight offsets
AutoNation cooled faster—vol fell back below 40 % by mid-2021—as record used-car pricing and scant inventory lifted margins to all-time highs. A fresh uptick appears in 2023 when higher rates eroded affordability and first-quarter profit slid 20 % year-on-year. By mid-2025, Gap still commands the higher risk premium (~60-70 % vol versus AutoNation’s ~30-35 %), reflecting its structurally thinner gross-margin buffer and fashion execution risk.
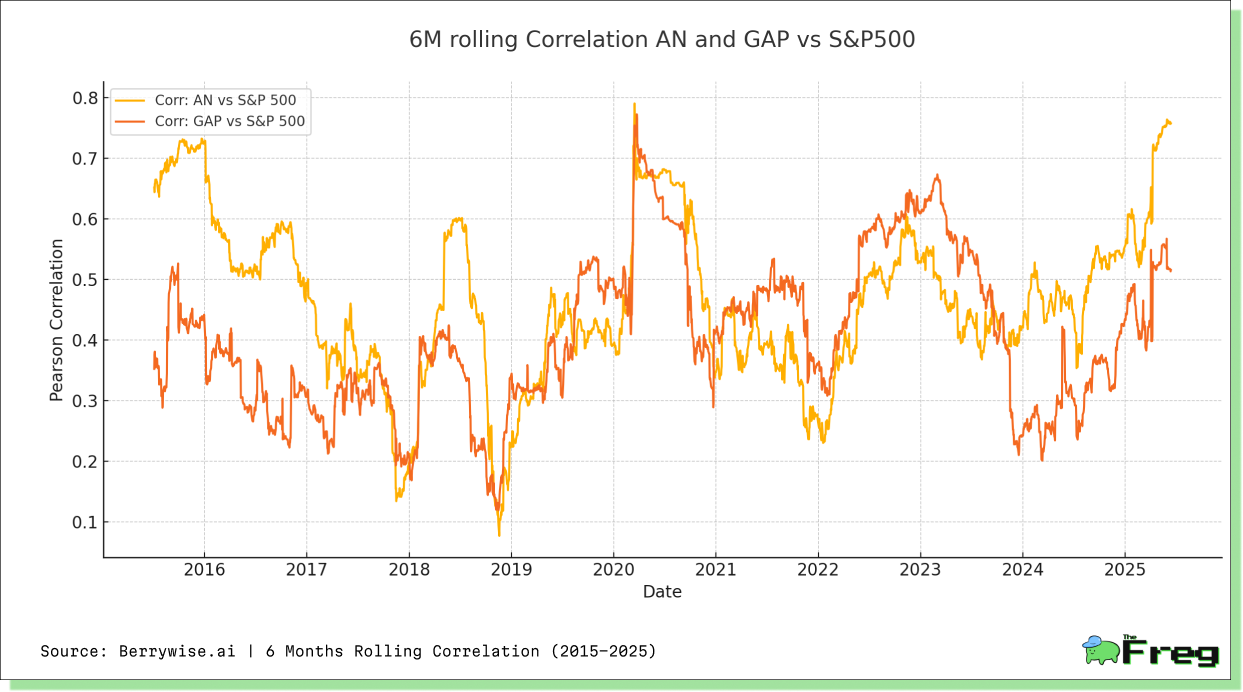
Six-month correlations oscillate but generally sit in a 0.4-0.7 band. AutoNation’s link to the index loosened during the 2020-21 used-car boom (dip to ~0.2) as pricing dynamics overrode macro factors; it re-converged toward 0.5-0.6 once supply normalised. Gap’s correlation rose after late-2022 management change—CEO Sonia Syngal’s departure cleared the way for a reset—and surged above 0.7 in May 2024 when a sharper merchandising push drove a 23 % pre-market share pop.
Overall, AutoNation shows a lower-vol / moderate-beta profile anchored in cyclical but asset-backed economics, while Gap trades as a high-vol / higher-beta discretionary name whose stock narrative whipsaws with execution headlines and supply-chain swings.
AutoNation vs The Gap Inc.: Return Distribution
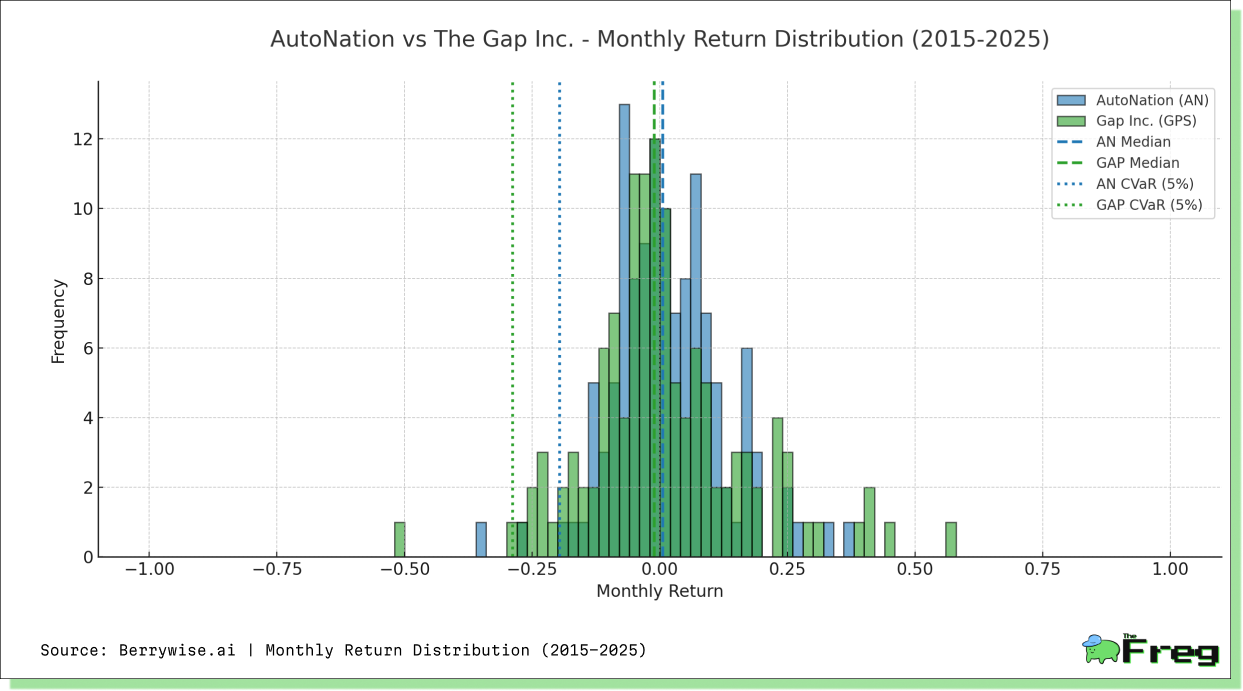
AutoNation’s monthly returns are skewed slightly positive, clustering tightly around +1% with a thinner left tail (CVaR ≈ -19.7%). Gap’s curve is far wider: dispersion stretches beyond ±40 % and the 5 % tail risk deepens to almost -29 %. The heavy-tail episodes largely coincide with 2020’s apparel-store shutdowns and the subsequent 2021 freight-surcharge shock, when management warned of a potential $550-$650 million sales hit from Vietnam factory closures and port congestion.
By contrast, AutoNation benefited from the unprecedented 54 % YoY spike in used-car prices in April 2021—an inflation outlier tied to chip shortages and fleet rental demand. That favourable backdrop explains the stock’s fatter right-hand tail and a higher median (+0.52 % versus Gap’s -1.08 %).
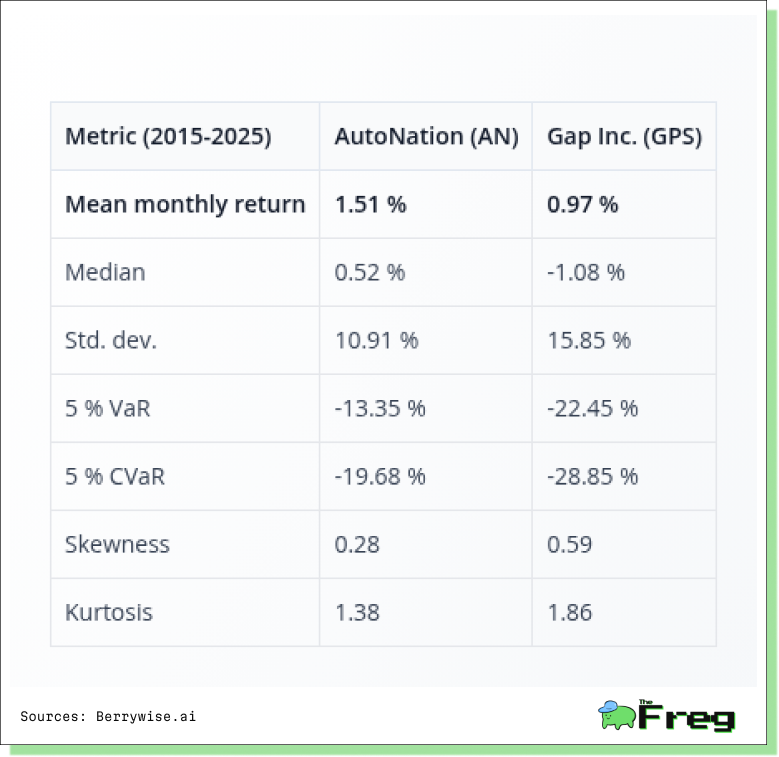
Macro tightening later in the window—eight Fed hikes totalling 400 bp in 2022-23—dampened both distributions, but the impact was sharper on the discretionary apparel basket as higher borrowing costs curbed fashion spend. Overall, the histogram underlines AutoNation’s “middle-lane” risk footprint: narrower volatility yet still cyclical, whereas Gap retains pronounced swing characteristics driven by execution and supply-chain factors.
Which Stock Looks Stronger Now?
Gap Inc. and AutoNation share the same GICS address yet reside in different financial neighbourhoods. Over the past decade AutoNation’s stock compounded at 11.6 % versus Gap’s –3.2 %, propelled by record vehicle margins and relentless buybacks. But 2025 fundamentals reset the debate.
Balance-sheet safety vs. leverage – Gap ends Q1-25 with ~$2.2 billion cash and no net debt after shrinking stores and inventory. AutoNation carries ~$4 billion of borrowings, pushing net-debt/EBITDA above 10×; if rates flare again, the apparel retailer enjoys far greater flexibility.
Margin trajectory – Gap’s turnaround is expanding operating margin (+140 bp YoY to 7.5 %) as AI-guided assortments boost full-price sell-through. AutoNation’s new-car spread is normalising; gross margin compressed and mix is tilting toward lower-margin models.
Cash conversion and payouts – AutoNation remains a cash engine, converting 129 % of earnings and retiring 7 % of its float in Q1. Gap weathered seasonal outflows, kept a 3 % dividend and repurchased $70 million, preserving fire-power for peak season.
Growth catalysts – Gap’s upside—Athleta reset, tariff relief, Old Navy share gains—requires modest capital. AutoNation’s densifying acquisitions and captive-finance flywheel are accretive but depend on resilient credit and vehicle affordability.
Verdict
On core fundamentals, Gap now edges ahead. It couples rising margins with a fortress balance sheet, providing room to invest, sustain payouts and ride macro chop. AutoNation still offers superior historical wealth creation and a formidable buyback engine, yet high leverage and narrowing spreads make the risk-reward less forgiving late-cycle. Investors seeking defensive fundamentals with re-rating potential may prefer Gap; those favouring immediate cash returns and willing to stomach higher cyclicality may still select AutoNation. Keep a close eye on rate trends, inventory normalisation and election-year policy as decisive catalysts into 2026.
Disclaimer: This article is based on data analysis and does not constitute investment advice. Investors should conduct their own research and consult with financial advisors before making investment decisions. Past performance is not indicative of future results.


